
Being a sales manager isn’t easy. Apart from ensuring company growth, you also have to collect and present the right data in the best possible way just like Solarmovie does.
If you are struggling to make an effective sales report, the following tips should be able to help you out.
With so much data on your hands, it can be quite difficult to fit all of them in your report. This is why it’s important that you determine why you’re making a sales report in the first place.
Are you trying to pinpoint recent trends in your sales? Are you trying to determine the significant results of your promotional campaigns?
By knowing the purpose of your report, you’ll be able to gather and assess the right kind of data. Apart from that, it’ll also help you understand the scope of your report, increasing the success rate of your sales presentation.
Determine your audience.
Before writing a report, try to know your audience. This will make it easy for you to adjust your focus and tone, and make your sales report easier to understand.
For example, if you are reporting to a marketing head, it’s best to focus on the details of your marketing campaigns that caused an increase in your sales. That’s the part he’ll probably be most interested in.
In case you are presenting to your top management, try to highlight the big picture. Instead of talking about the specifics, show them details concerning the overall growth of the brand.
As a sales manager, the reports you make at work are important. They are the factors that the top management considers when making important business decisions.
Process your data properly.
Once you’ve determined your audience and your purpose in making your sales report, the next step is to gather your data.
To ensure accuracy, it’s not enough that you carry out your data collection process. You also have to make sure that it’s goal-oriented. You need to outline the specific metrics you are planning to include in your report.
A standard monthly sales report, for example, should include the number of items sold and net sales. If necessary, you may also want to include regional sales as well as team performance.
Use the right visuals. 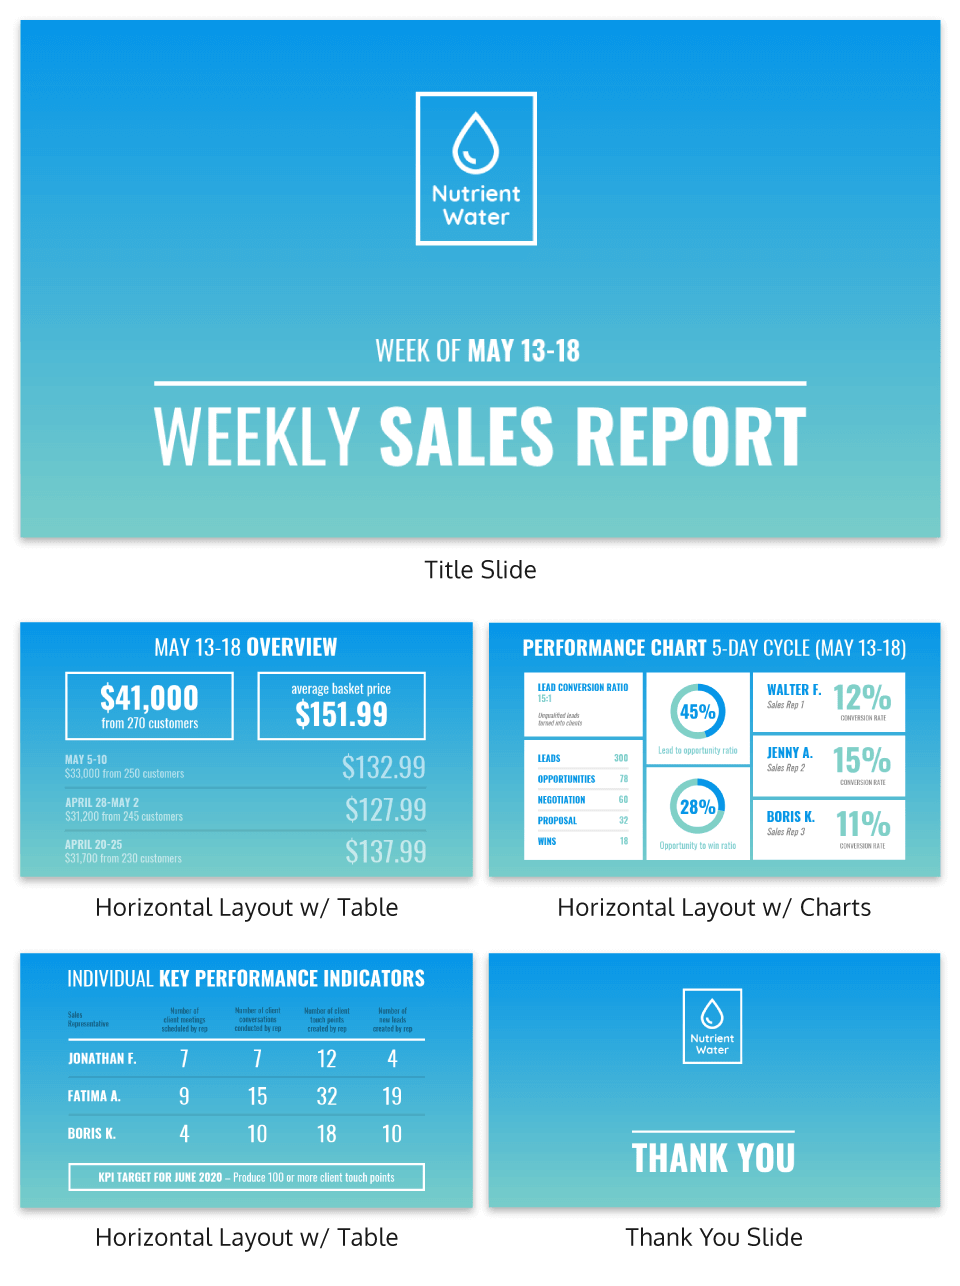
Your data isn’t the only factor you have to consider when writing a report. The way you present them matters, too.
Your presentation can affect your audience’s level of concentration or focus. Without the right visuals, you can easily end up making them feel bored and uninterested.
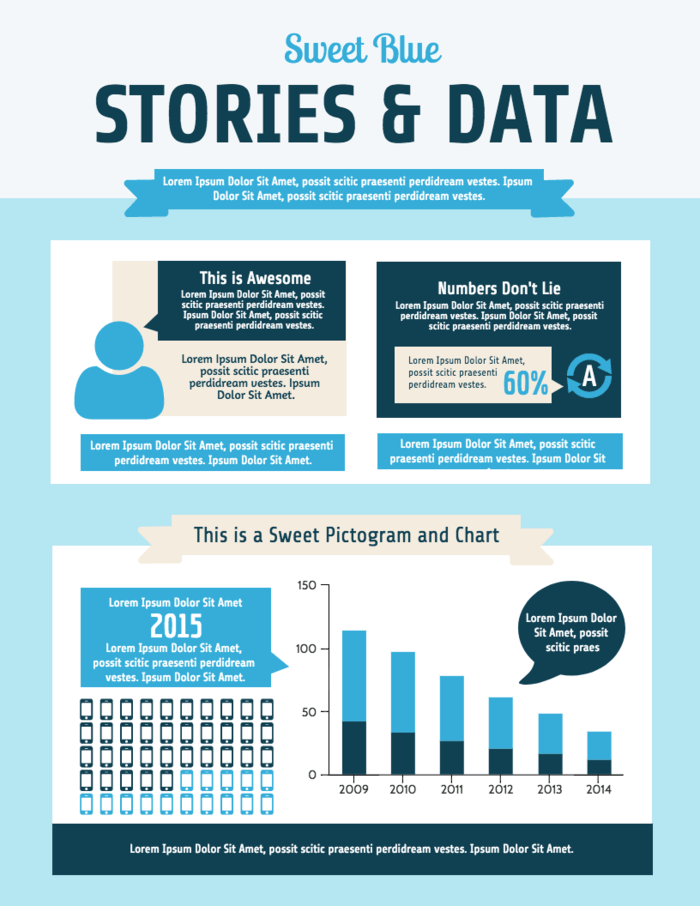
Instead of sticking with plain numbers, try to include graphs and charts in illustrating your data. You can also make an infographic, if applicable.
In case you are new to data visualization, there are beginner-friendly tools you can use. One excellent example is Venngage. It has a wide collection of high-quality images and templates you can use to impress your boss.
Visualizing data makes your reports easy to understand. It also enables you to highlight the most important trends and factors that are affecting your sales.
In addition to that, great visuals can help keep your audience from getting bored and falling asleep during your report. Even when it comes to security the visuals that are the nest cameras are prioritized.
Add context to numbers.
Handing over a huge bunch of numbers isn’t easy when it comes to reporting. It can mislead your audience and cause erroneous judgments.
One good example is a declining monthly sales report. At first glance, it’s easy for an executive to make a hasty decision after seeing a significant drop in your sales.
By leaving a note in your report about the reason for such drop, you’ll be preventing mistakes that can be detrimental to your business and team.
Stick to the facts.
Part of knowing how to write a report is understanding the need to stick to the facts. You need to be as objective as possible when presenting your data.
When reporting, limit your opinions to a minimum. Your audience is listening to you because they want to know the data and not what you think. Frequently throwing your opinions during reporting will just distract them.
There are types of reports that will require analyses and recommendations. They are usually done near the end of the report and not while you’re in the middle of presenting the important numbers and details.
Provide a summary.
Your report needs to be actionable. It needs to provide something your executives can use.
With that, try to provide a summary of the data you’ve presented. If necessary, you can also offer a logical conclusion.
For example, you can tell them where the business was and where you are now. In the end, you can show them how they can take things to the next level using the data you’ve presented in your report.
- Cost of Living Trends in Dallas for 2026Dallas has a reputation for being affordable compared to coastal cities, and for a long time that reputation held up pretty well. But 2026 looks a bit different. Prices across the board have shifted, some in ways people expected and some that caught newer residents... The post Cost of Living Trends in Dallas for 2026 […]